Data Model For Toyota Car Trends between 2016 to 2020
Capstone Project for Bachelor of Business Administration (BBA)
Technical Information
Software Used:
Date:
Client:
BCIT | Bachelor of Business Administration 2022
Introduction
The report analyses the total units sold and the regions (provinces) across Canada which they are sold in and calculates the net profit after repairs (Toyota, 2016-2020). The profit is gained by using the MSRP for each model of each year. Other costs not taken into consideration for net profit are parts, labour, building and maintenance and other potential costs.
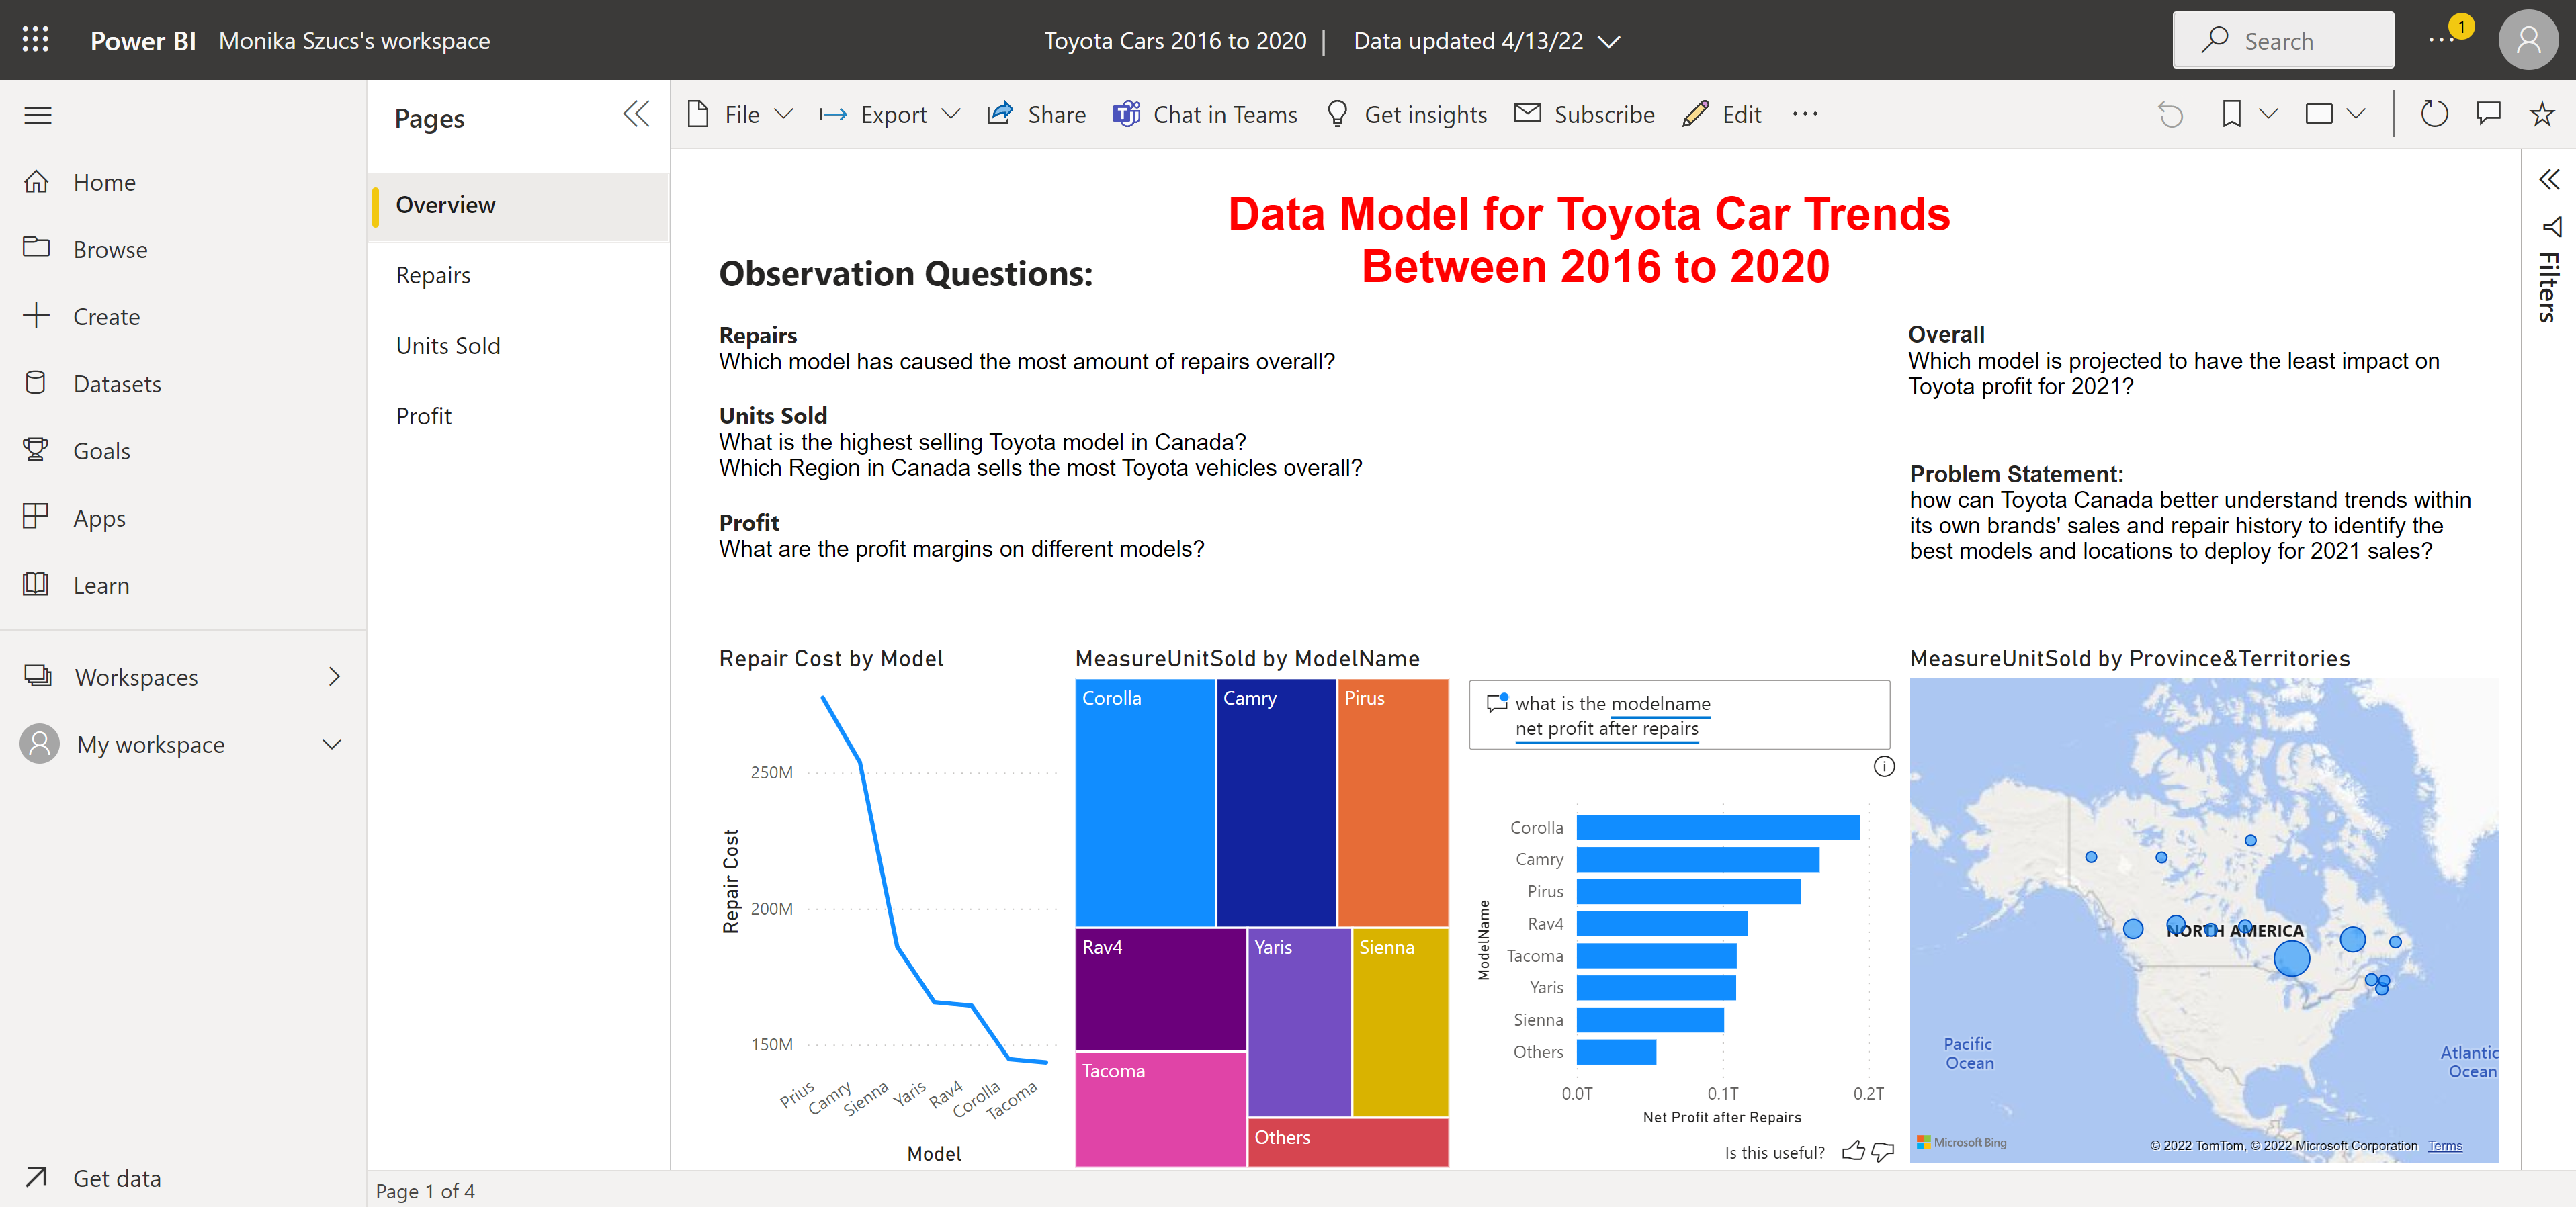
To understand which models to retain and which to pause, this raises the question: How can Toyota Canada better understand trends within its own brands sales and repair history to identify the best models and locations to deploy for 2021 sales?
The data analytic questions asked in the observation include:
- What is the highest selling Toyota model in Canada?
- Which Region in Canada sells the most Toyota vehicles overall?
- Which model has caused the most amount of repairs overall?
- Which models have higher profit margins?
- Which model is projected to have the most impact on Toyota profit for 2021?
Process
Process, Limitations and Assumptions
Data was downloaded from one web site to receive the total number of Toyota vehicles sold within Canada during the five-year period. Due to limitations around sourcing the number of specific models, this data was created manually and calculated based on population research. The cost of repairs and MSRP per Model was also created manually, based on research of each model and their MSRP for the 5-years.
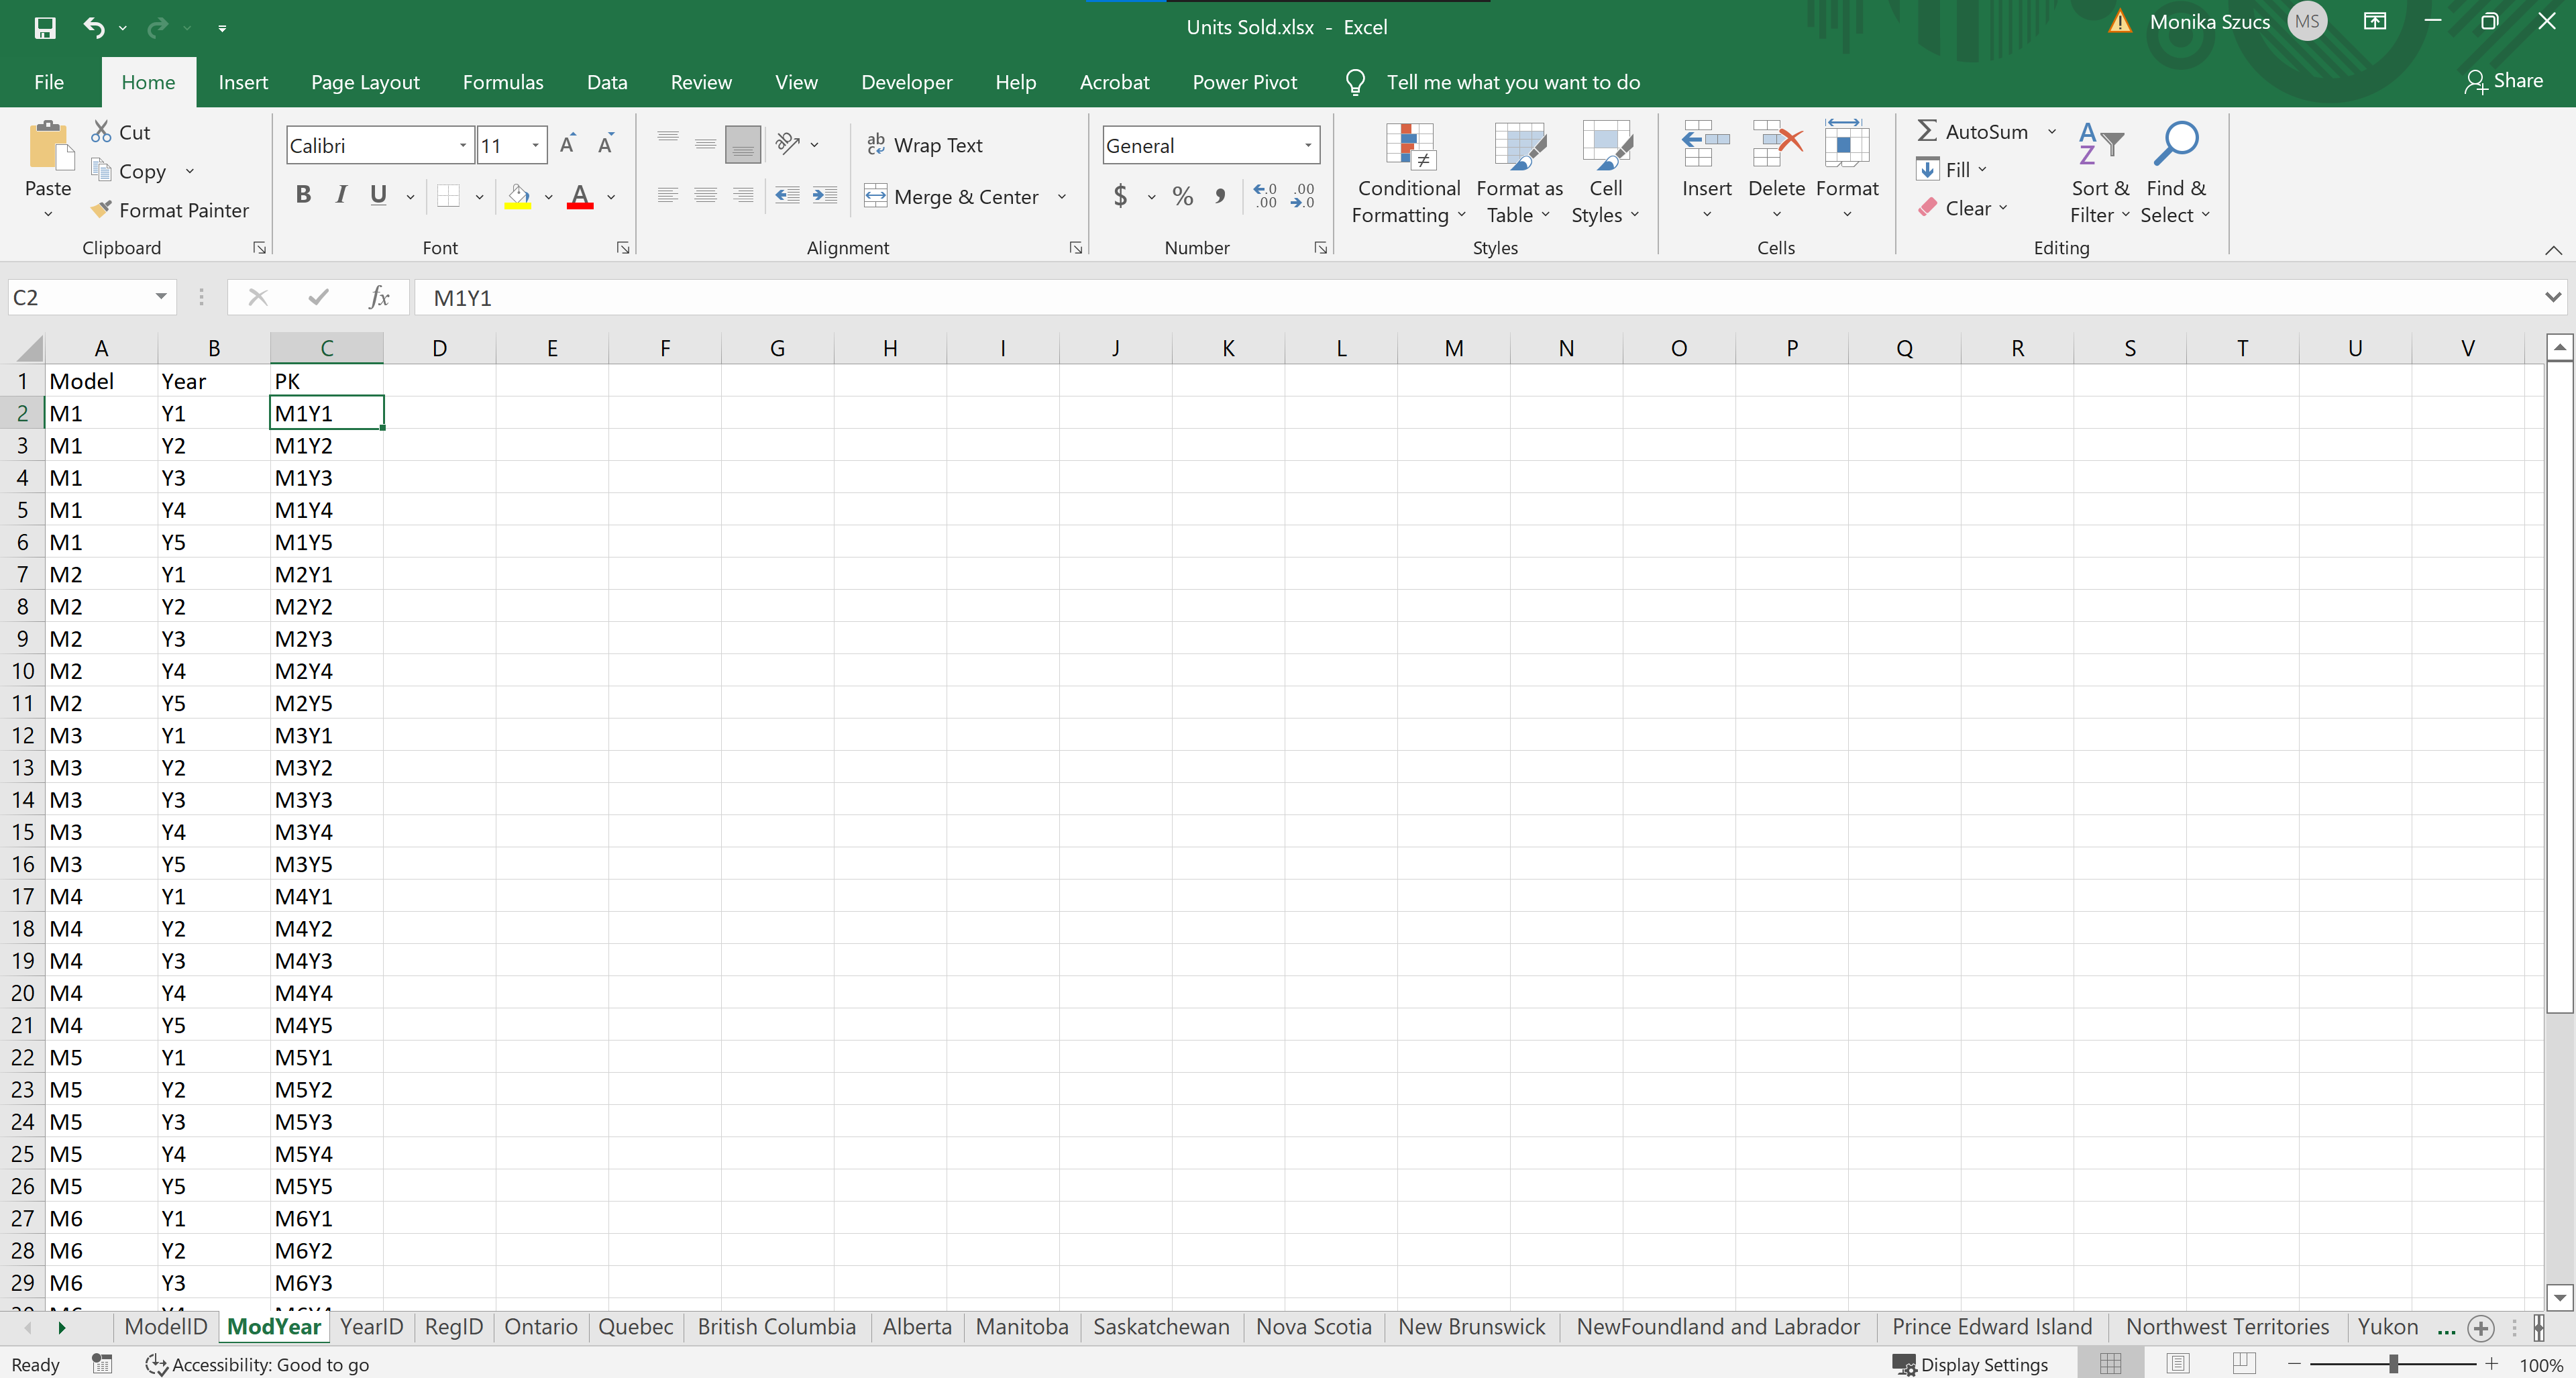
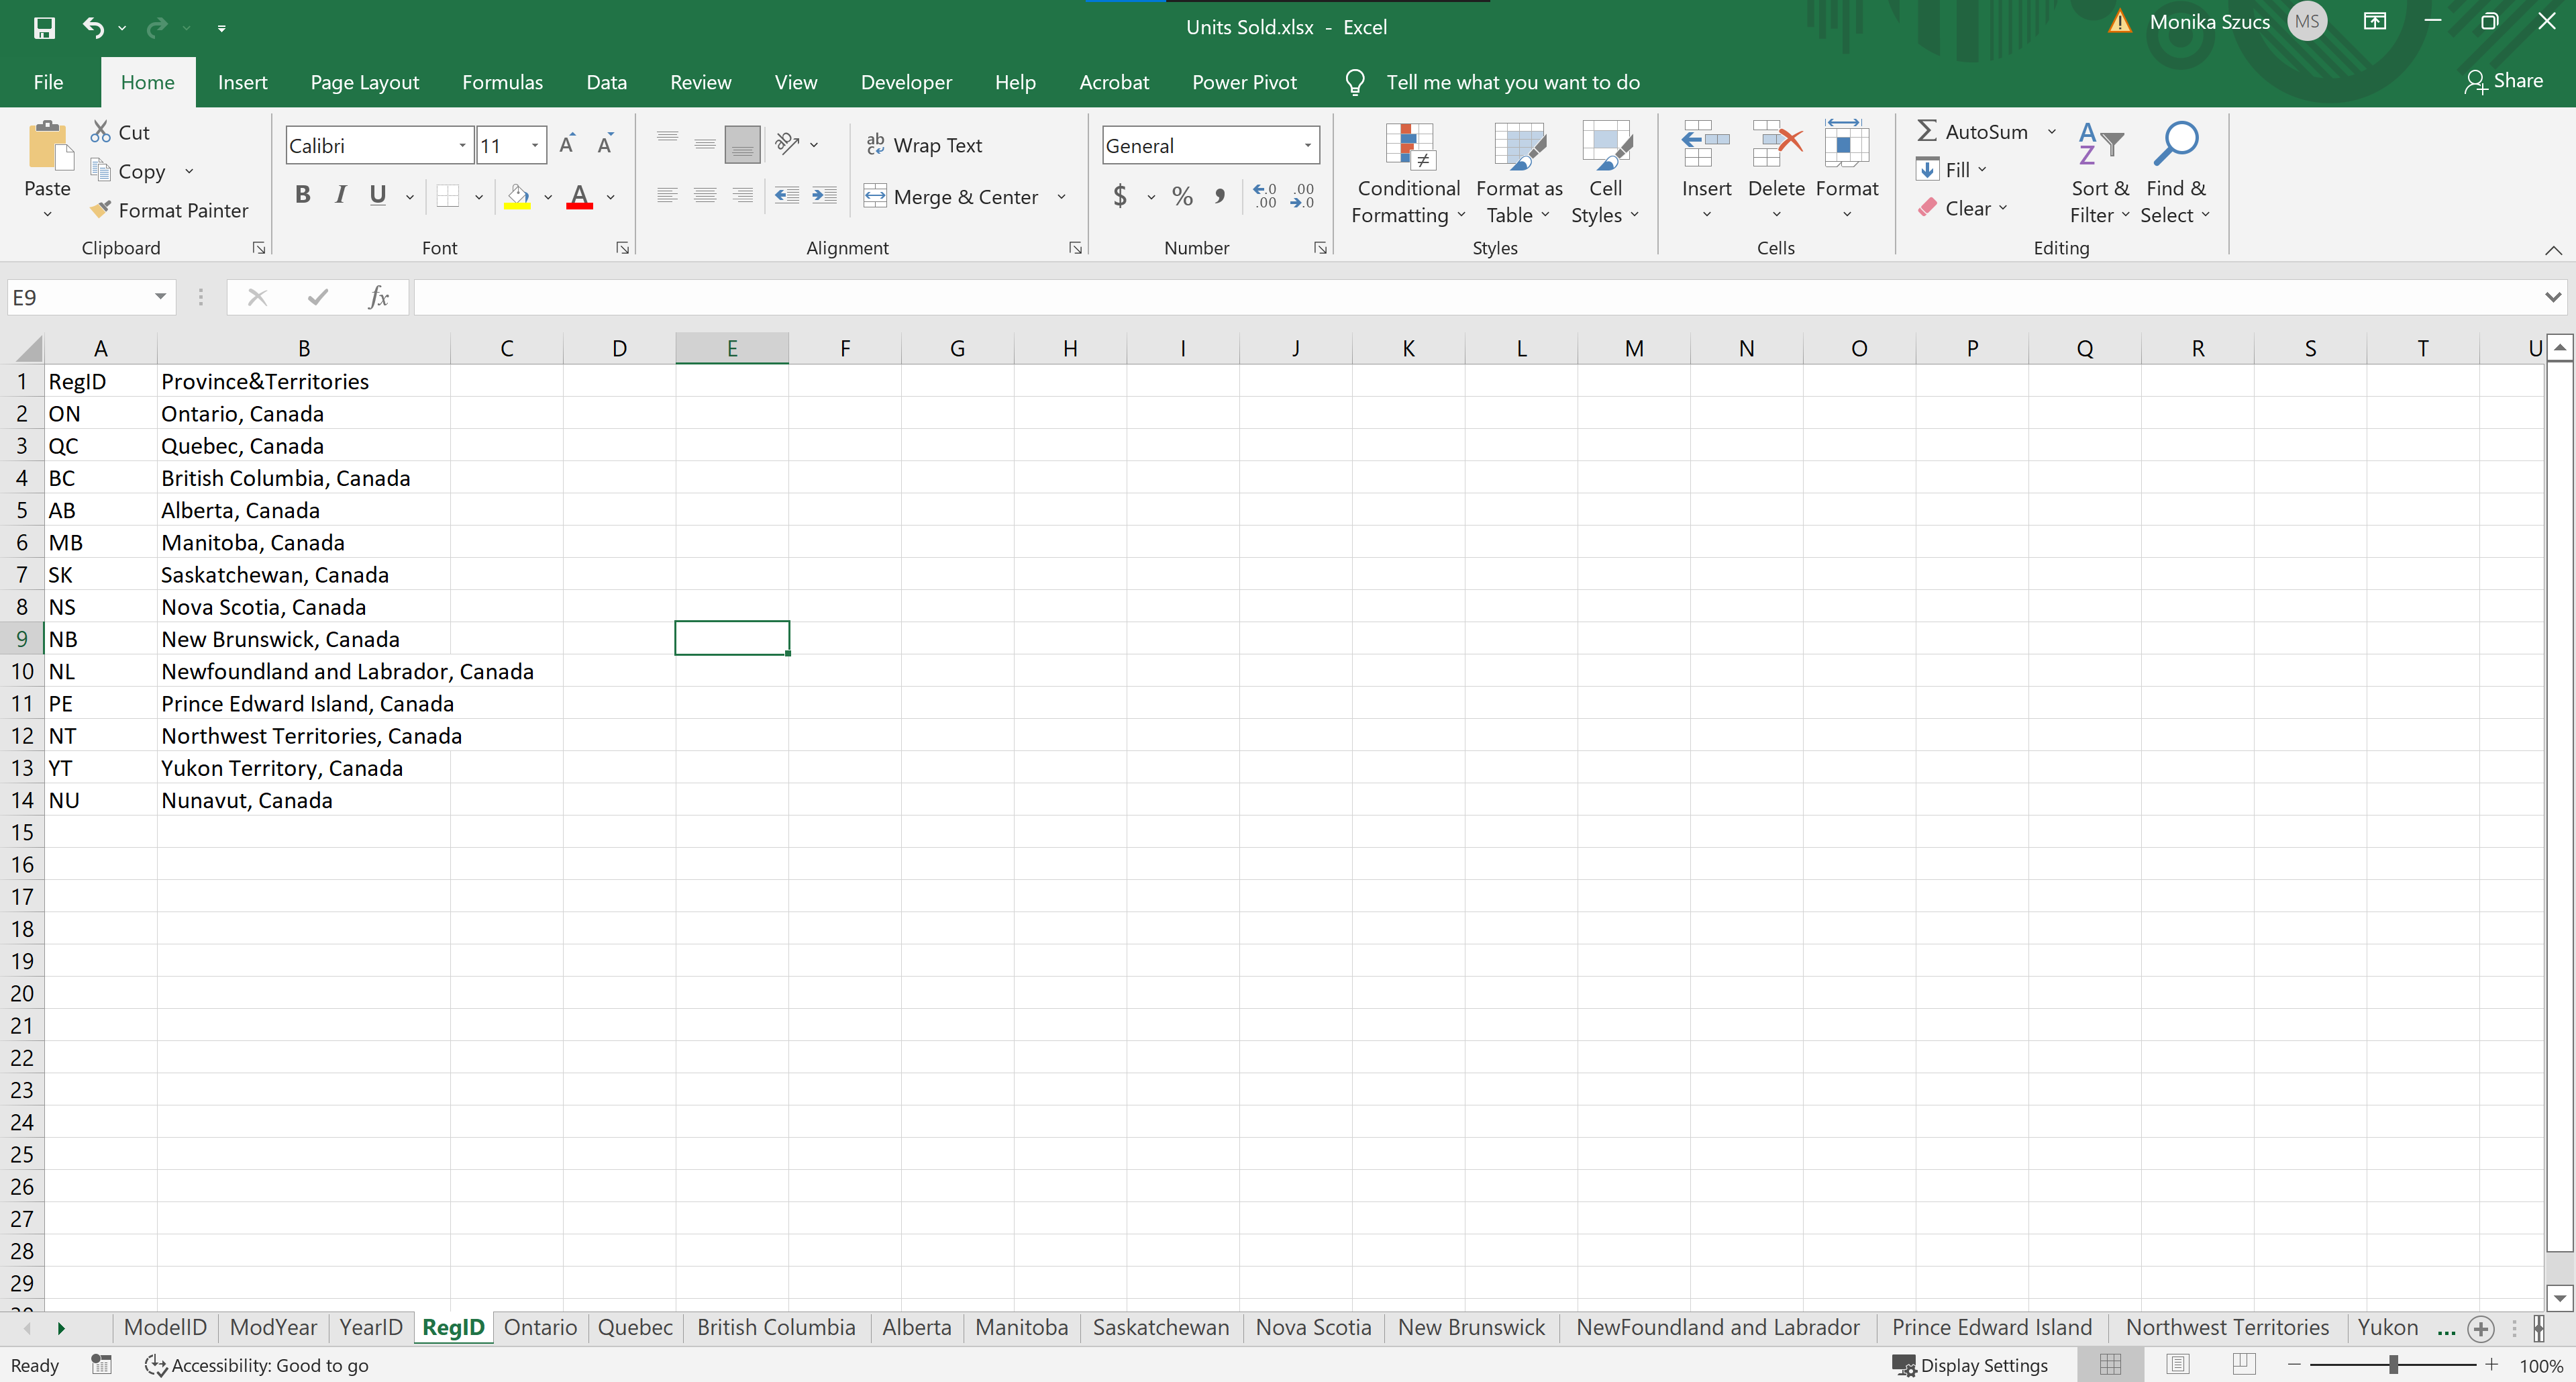
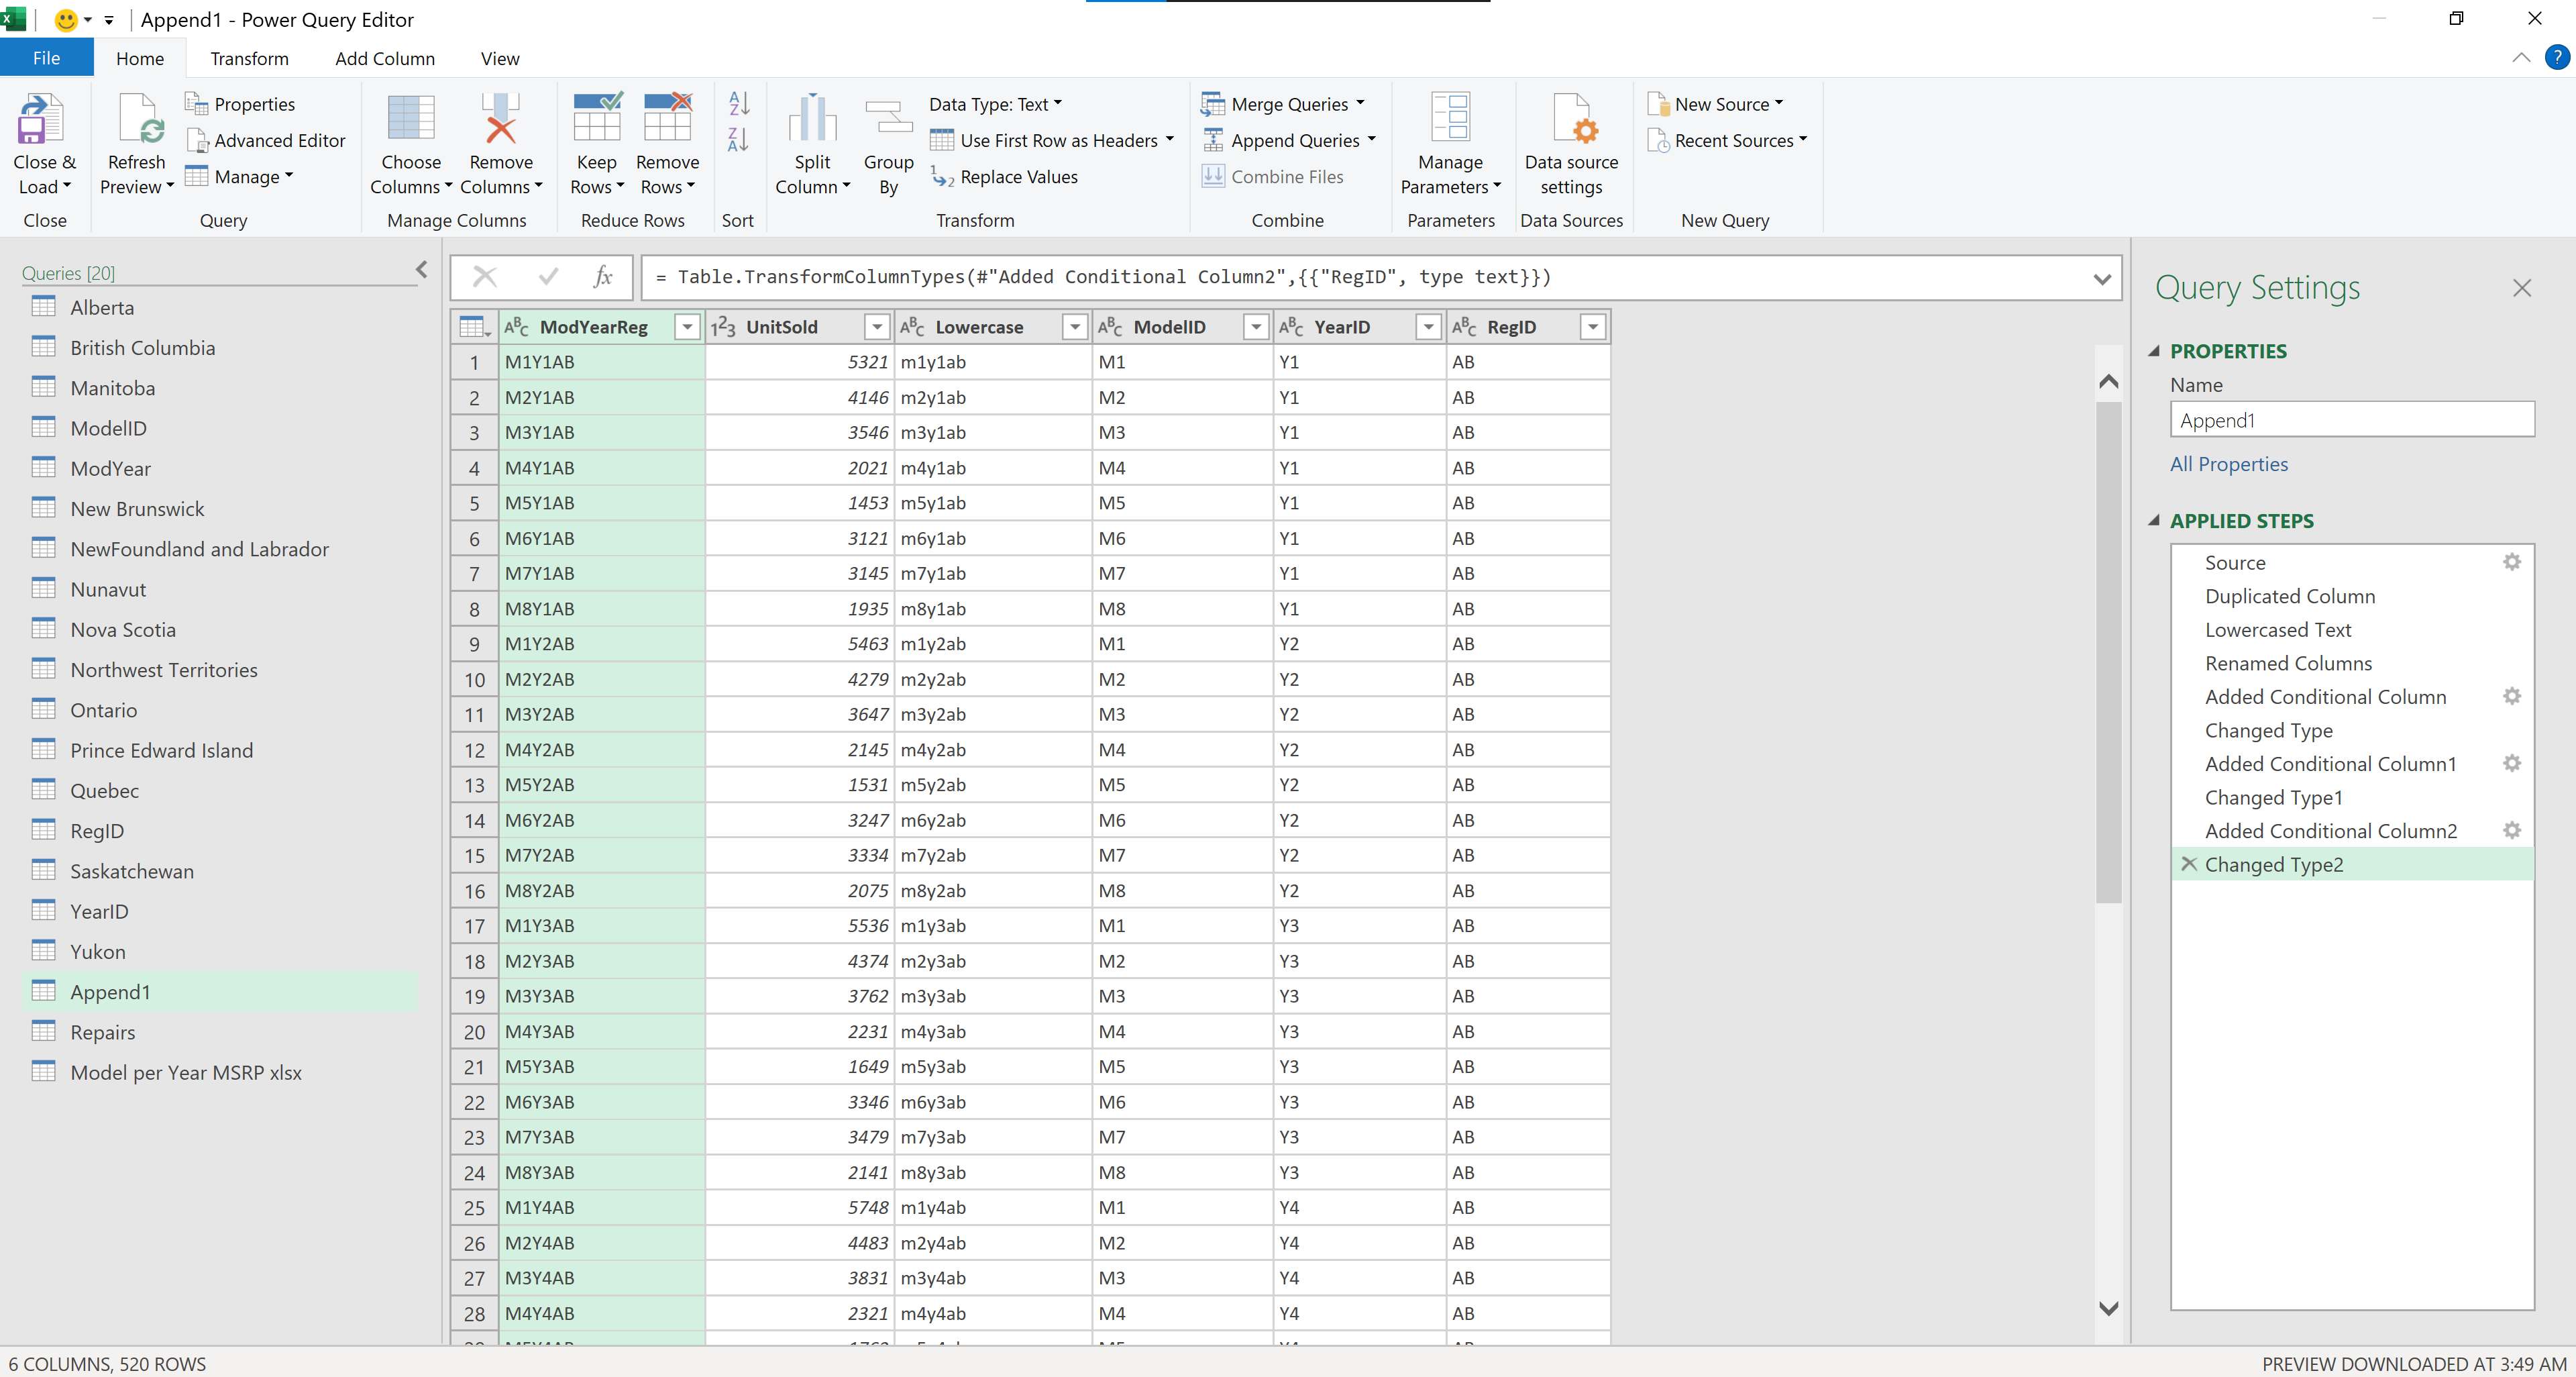
The limitations on the region included not having the data for different locations within each of the province’s Toyota dealerships. The data was obtained by calculating the aggregate of each province. The data collected could determine which province has the most car sales however it is unable to determine within each province which specific dealership sold the vehicles. To practise different techniques of analysing data, it is assumed that data for each province and territory comes in a text format of ModelYearRegin. Therefore, it was required to separate each part of the data that belonged to each category. The outcome was thirteen sheets demonstrating the number of cars sold by year and model.
Within the repair dataset assumptions were taken to categorise each repair type in a minor, major and extreme category. This decision was based on what the average person may consider to be the least up to most critical in safety or vehicle operation.
This report is taking assumptions that all new vehicles sold were at their posted MSRP price and sold within the year they were new. Profit is considered net profit after recall repair and maintenance costs. Additional costs such as the production materials, delivery and overhead were not removed from profit. Data collected for the vehicle costs in Canada were pulled from Toyota sites for each of the seven models, for the years 2016 to 2020 (inclusive) (Toyota, 2016-2020). Limitations for the MSRP included googling the posted MSRP value for each vehicle in Canada for each year.
Logic
Question 1: What is the highest selling Toyota model in Canada?
To assist with identifying which models to focus production on, it’s imperative to understand which model is the highest selling overall in Canada.
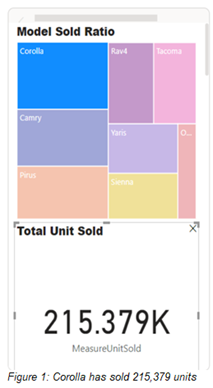
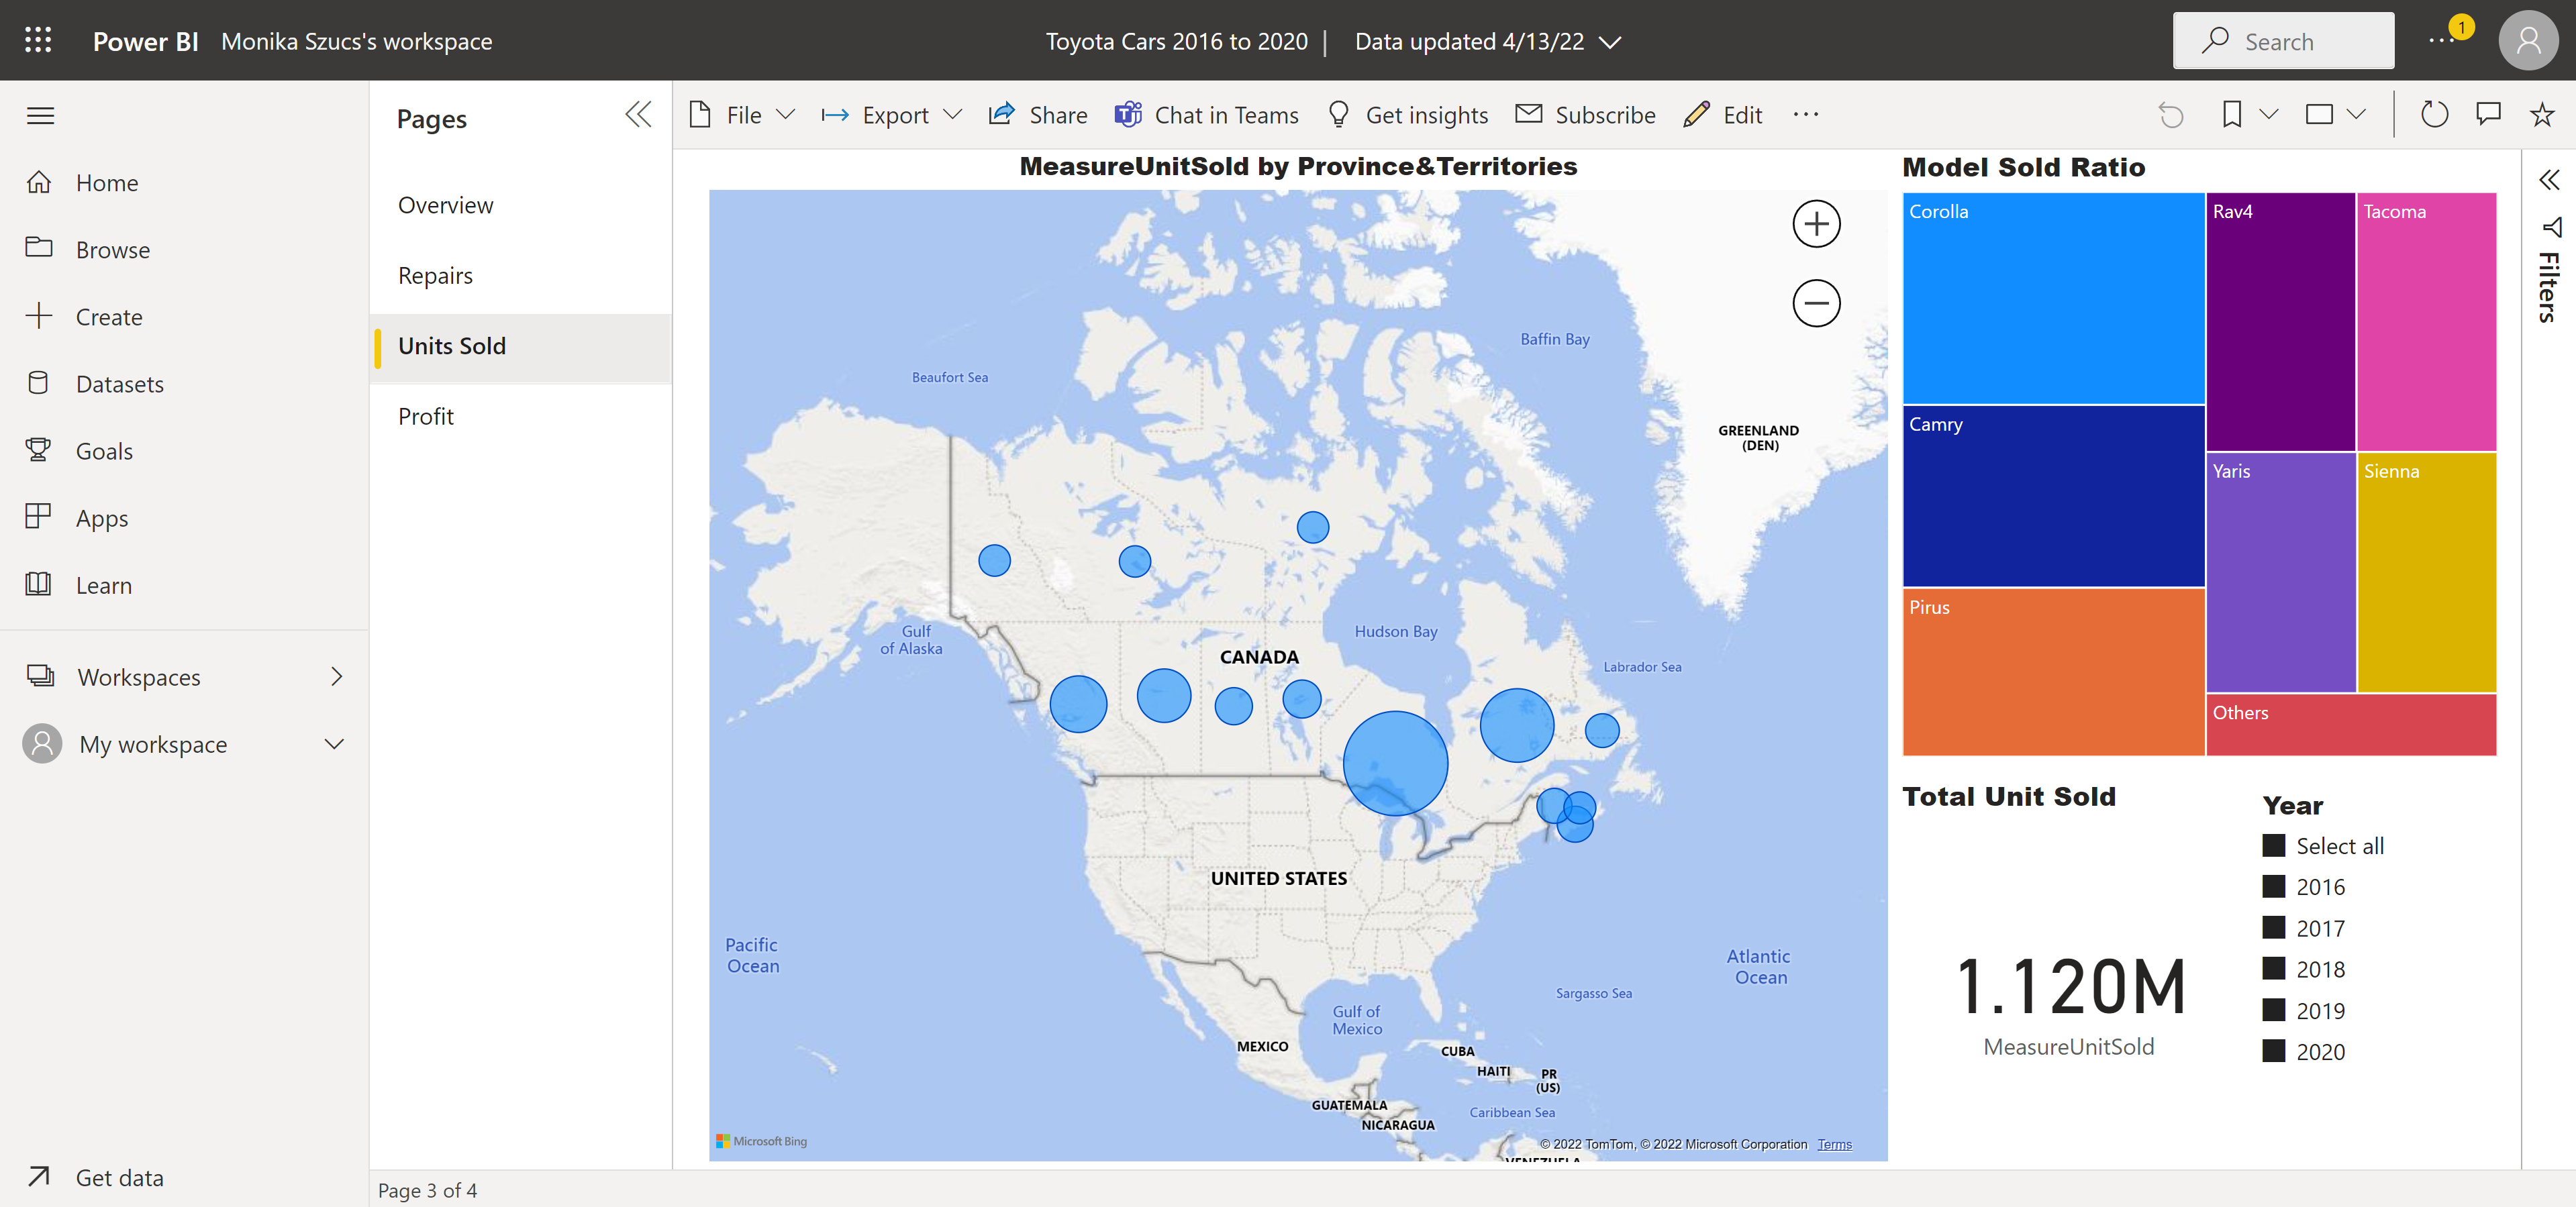
From the datasets, it reports that the highest selling Toyota Model in Canada is Corolla with 215,379 units between 2016 to 2020.
Question 2: Which Region in Canada sells the most Toyota vehicles overall?
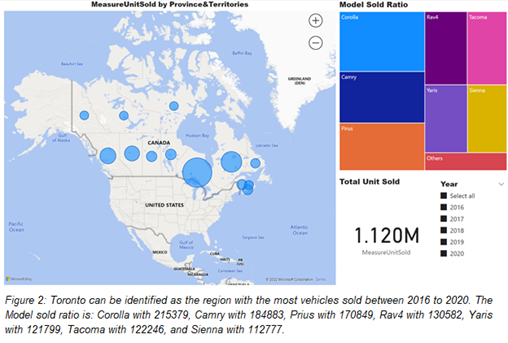
By looking at the data presented in the visualization report, it clearly identifies that Ontario is the leading province to have the most overall units sold. Trailing behind are Quebec and British Columbia.
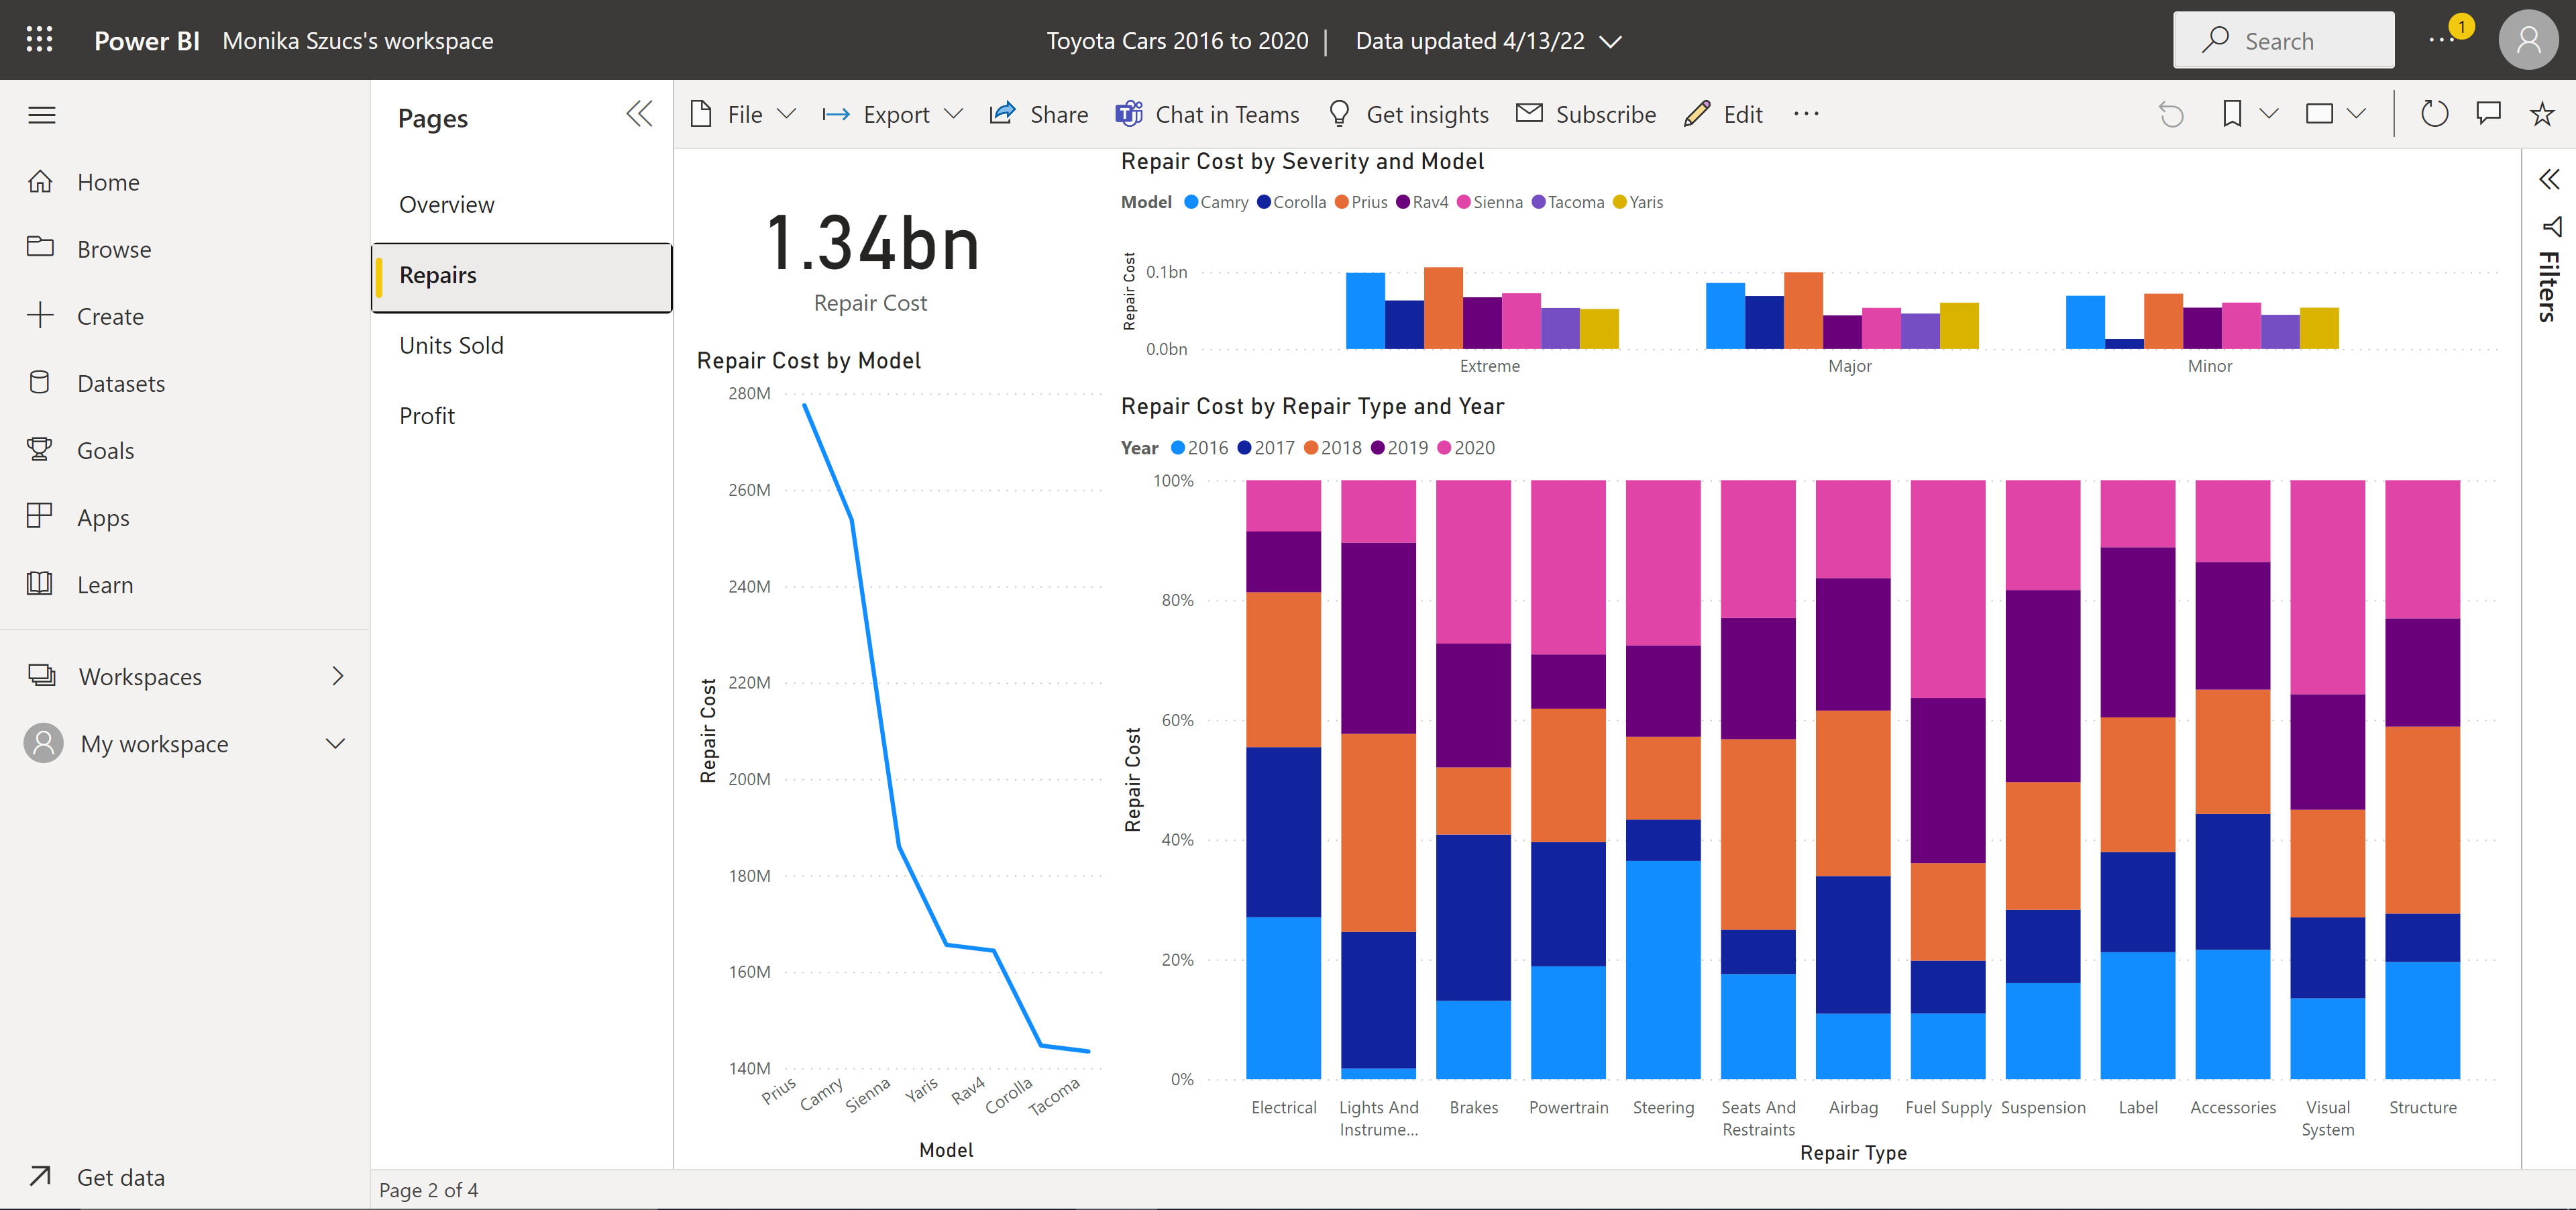
Question 3: Which model has caused the most amount of repairs overall?
To better understand which vehicles Toyota may look to pause production on it’s important to understand the recall and repair costs a model may cause to the overall net profit.
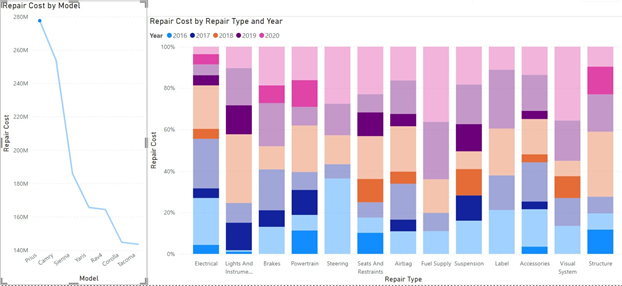
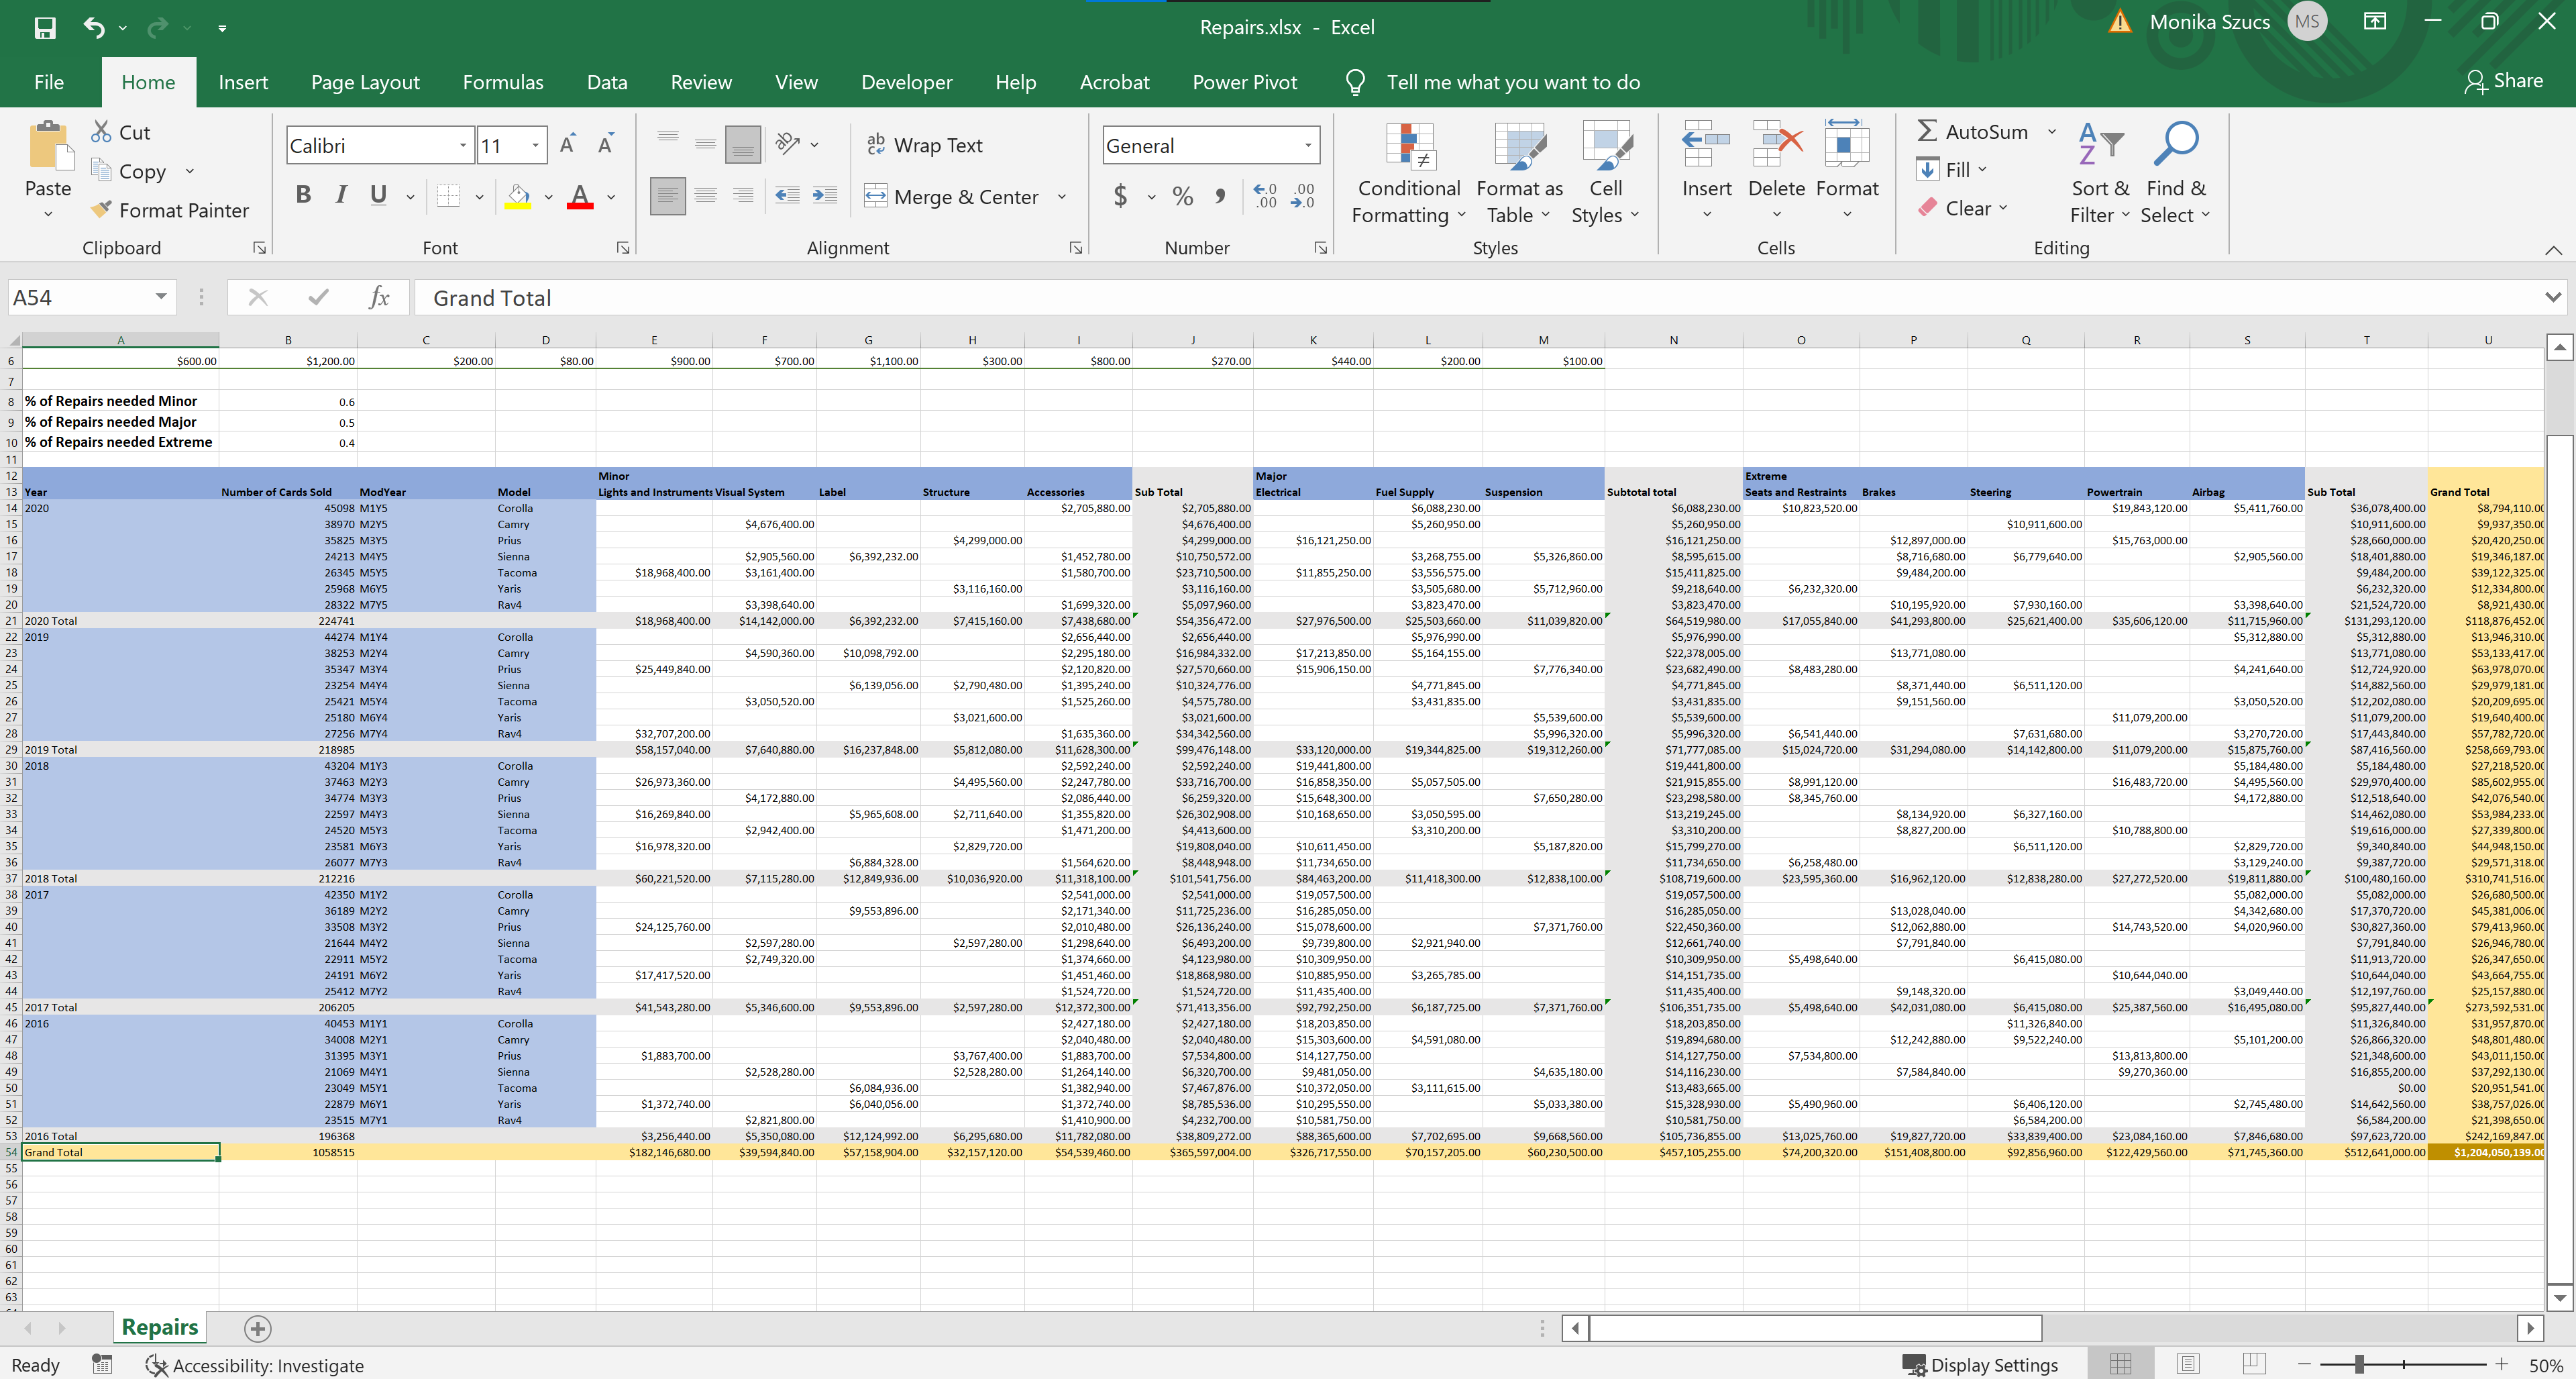
From the data collected, this report identifies that Pruis has caused the most amount of repairs overall. The below image shows a financial impact of close to $280 million over the course of five years. The graph shows that the most repairs come from seats and restraints, suspension, powertrain, and lights and instruments.
Question 4: Which models have higher profit margins?
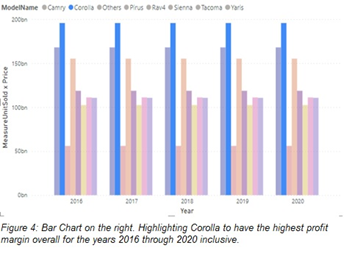
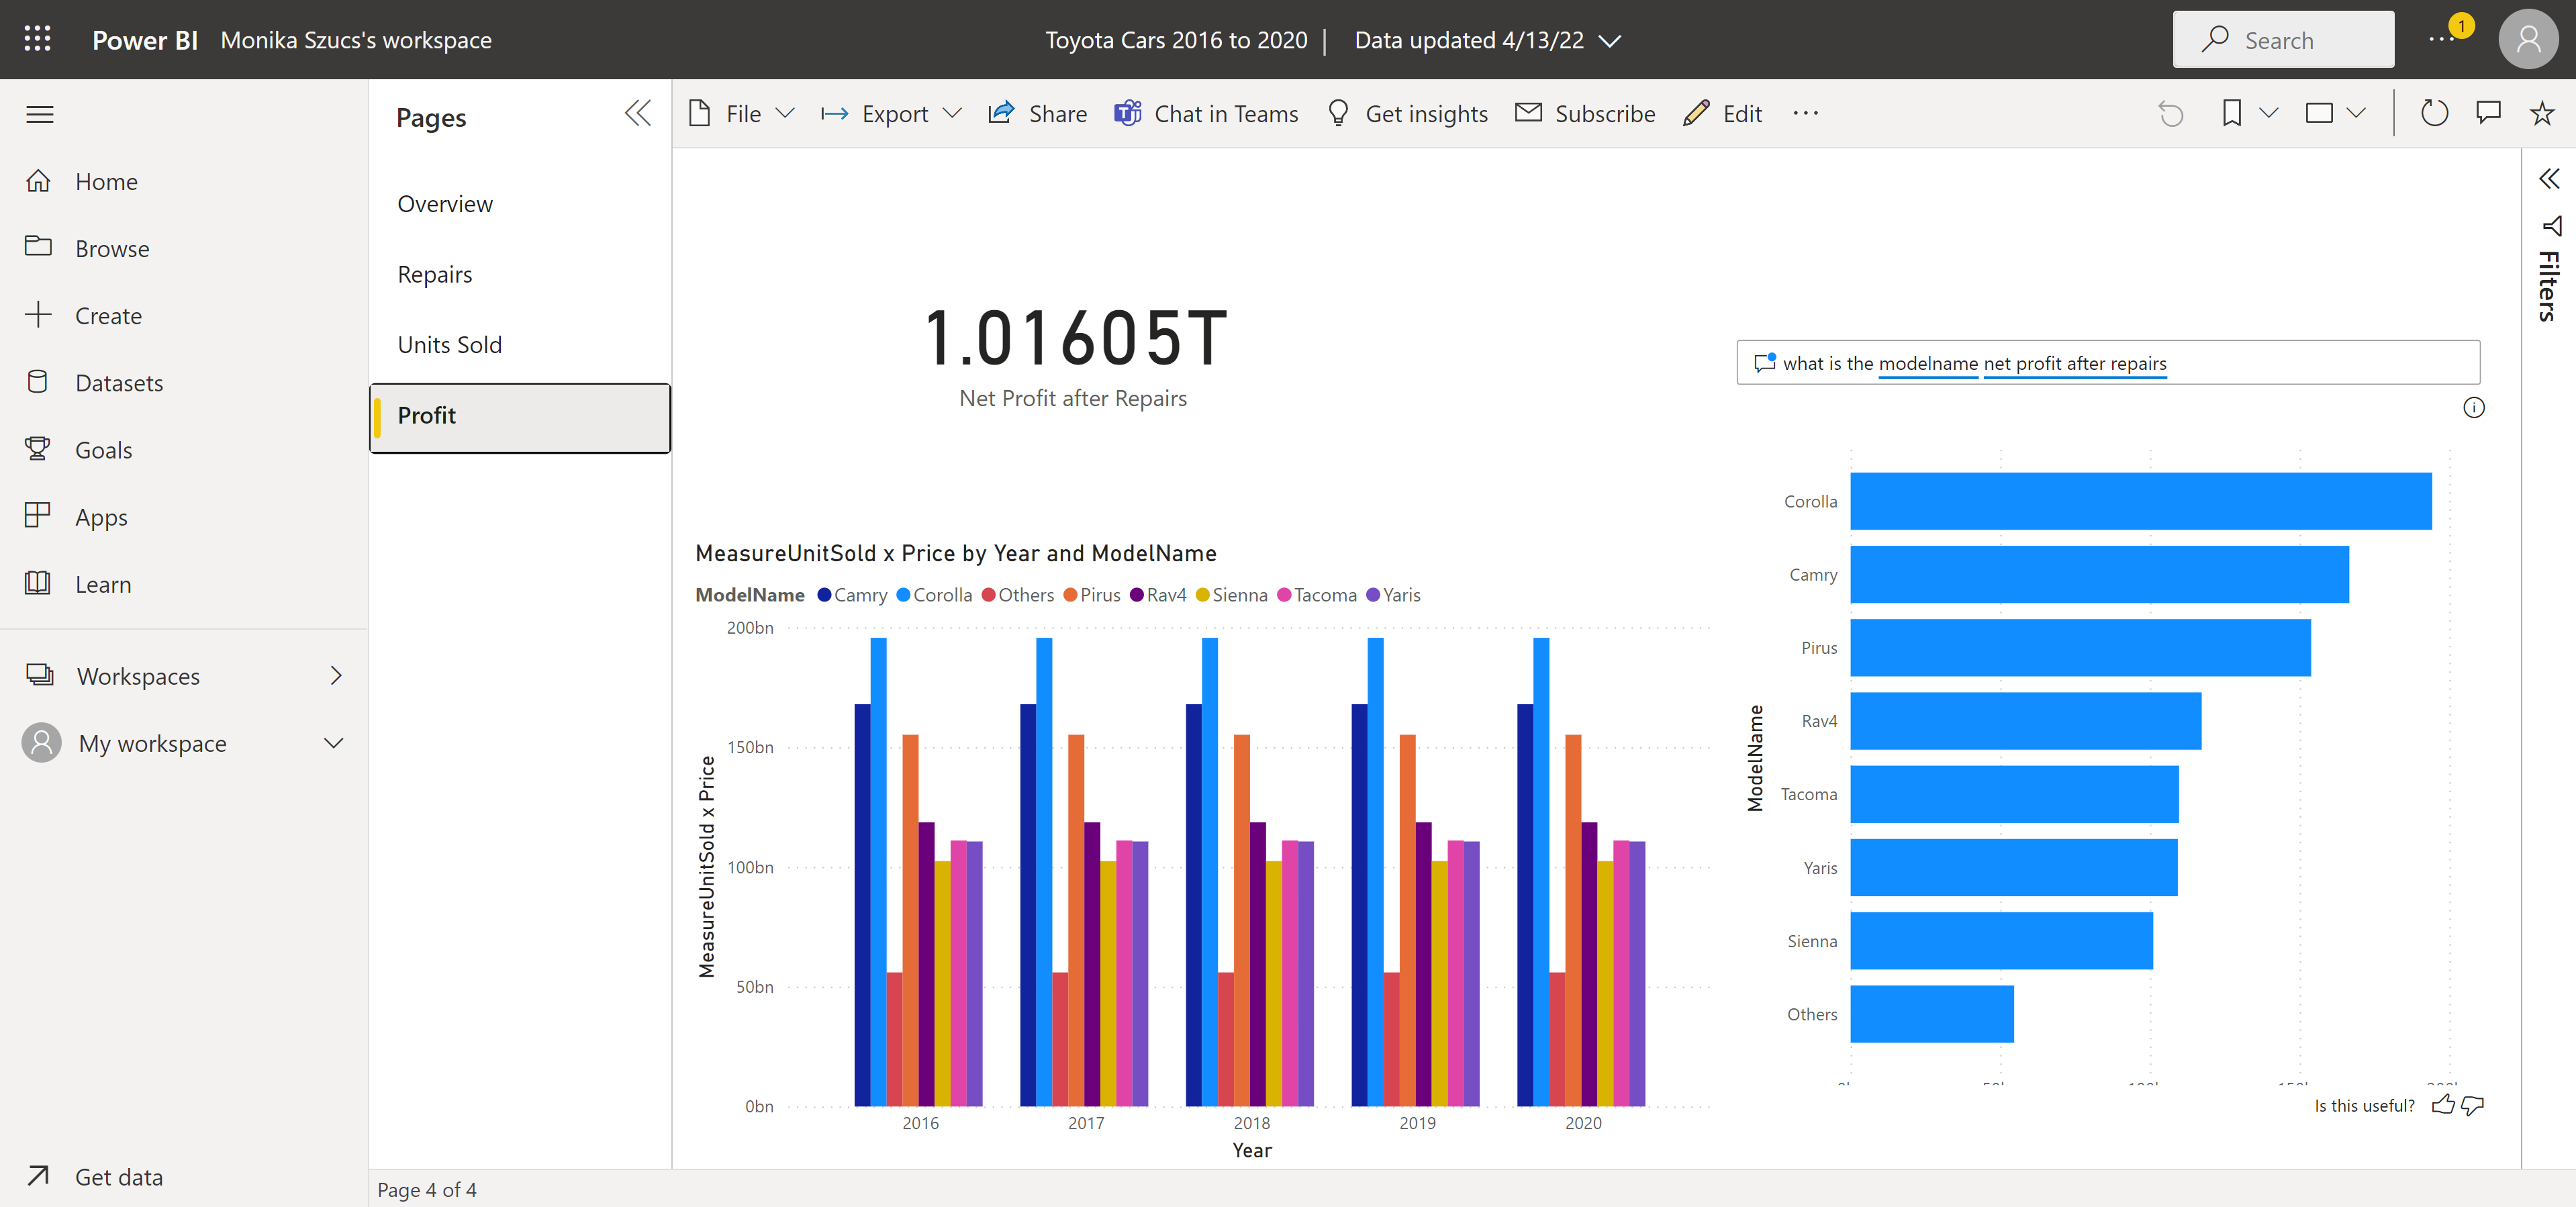
The vehicle which drives the highest sales may not help drive the highest overall profit for Toyota. Additionally, the vehicle which results in the most recalls and repairs may not be the least profitable due to sales volume. To understand net profit after repairs this report calculated the total sales for each of the seven models, and removed the repair cost for each. The Corolla is identified to drive the highest overall profit, followed by the Camry.
Solution
Based on this report analysis of Toyota’s select seven models – including the Prius, Camry, Sienna, Yaris, Rav4, Corolla, and Tacoma – from 2016 to 2020, it has been identified that the Sienna will drive the lowest net profit overall, followed close behind by the Yaris. With the eventual shortfall of semiconductors which will soon impact Toyota Motor Corporation, Toyota Canada recommends focusing on these two models to pause production and deployment to dealerships across Canada. Adversely, production should continue as much as possible on the Corolla and Camry models as they have the least impact on Toyota’s profit and highest overall sales volume. Since Ontario has the most sales, it is recommended to focus deployment to this province and Toyota should find ways to maintain as close to the current production and deployment of vehicles in order to meet the demands of the customers, followed by Quebec and British Columbia. With the current supply chain issues affecting the production and distribution of semiconductors, Toyota Canada should consider setting this recommendation in motion promptly.


